Parsing of electrophysiological mapping data. We support the following mapping systems and simulation software:
CARTO, Rhythmia, MonoAlg3D, OpenCARP, OpenEP
A diagnostic software framework to - automatically - determine the source of a given arrhythmia. Using network theory on cardiac excitation, OpenDGM is capable of detecting all critical boundaries, to allow the optimal ablation line in each case.
OpenDGM is actively maintained and new features are added regularly. It is open source and free to use under the GPLv3. GNU GENERAL PUBLIC LICENSE version 3.
Each core object - mesh, graph, cycles, ... - has its own wrapper class for quick access, manipulation and visualization.
Our modular approach makes it easy to swap different parts in your pipeline to test different setups. The in- and output of a module stays the same. What happens in between is up to you!
Modules make it easily scalable. Run and compare multiple cases or run your algorithms over a whole parameter space.
Parsing of electrophysiological mapping data. We support the following mapping systems and simulation software:
CARTO, Rhythmia, MonoAlg3D, OpenCARP, OpenEP
Processing of signal data. Multiple filters are implemented as well as different ways to annotate signals and extract local activation times.
Creation and processing of graphs. Includes methods to merge multiple graphs as well as filters to remove unwanted edges.
Topology bases objects and processing toolkit to manipulate those objects. These objects together with Graph form the basis for in- and output of our other modules.
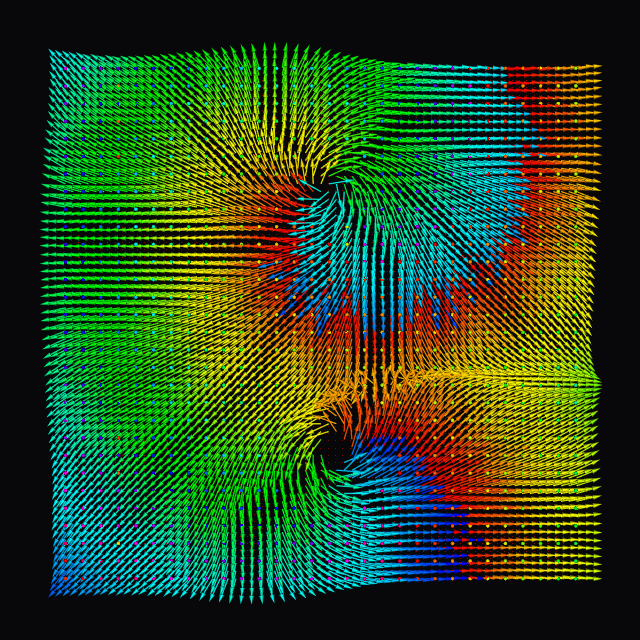
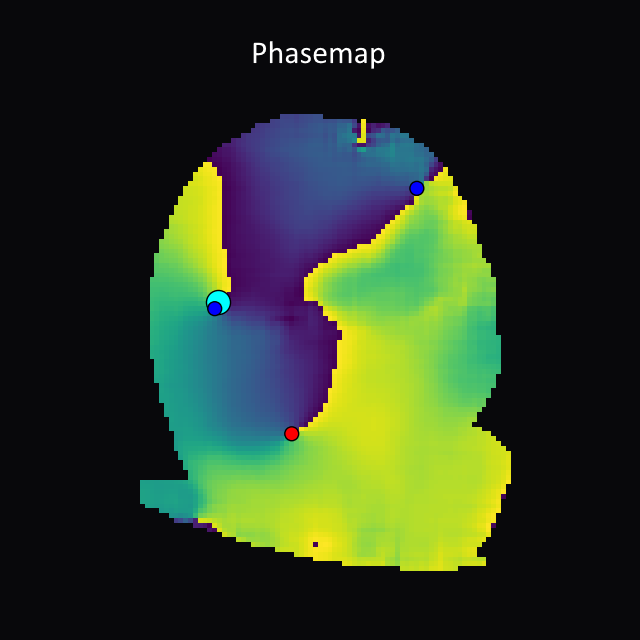
.Algorithms to detect phase singularities, reentry cycles, focal sources, (critical) boundaries.
Using topology, phasemapping, helmholtz, cycle search and others.
plot.py A lightweight PyVista wrapper for easy visualization, including animations, time series and widget functionality.
Visit our code repository and get started now!
git clone https://gitlab.com/opendgm/opendgm.gitcd opendgmpip install .Show / Hide text
Let's see how it works! The visualization of each step is shown below.
We start by importing the needed modules and load some data.
import numpy as npfrom opendgm.topo import Mesh, SklClusteringfrom opendgm.graph import Graph, CvFilter, DeltaLatFilterfrom opendgm.algorithm import CycleSearch
! Parsers are available for major mapping systems and simulation software such as CARTO, Rhythmia and OpenCARP.
points = np.loadtxttriangles = np.loadtxt.astypescalars = np.loadtxt
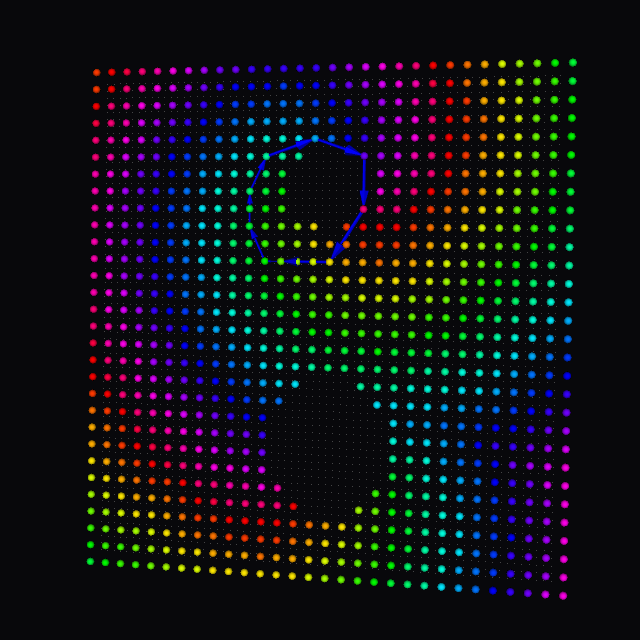
We construct a Mesh object and sample points at a regular distance of 4.
# Sample mesh nodesmesh = Mesh.from_arrayssample_nodes = mesh.sample
With these sampled points, we construct a Graph. Connections are filtered out based on edge length, conduction velocity and difference in local activation times.
# Construct graphgraph = Graphgraph.filtergraph.filter
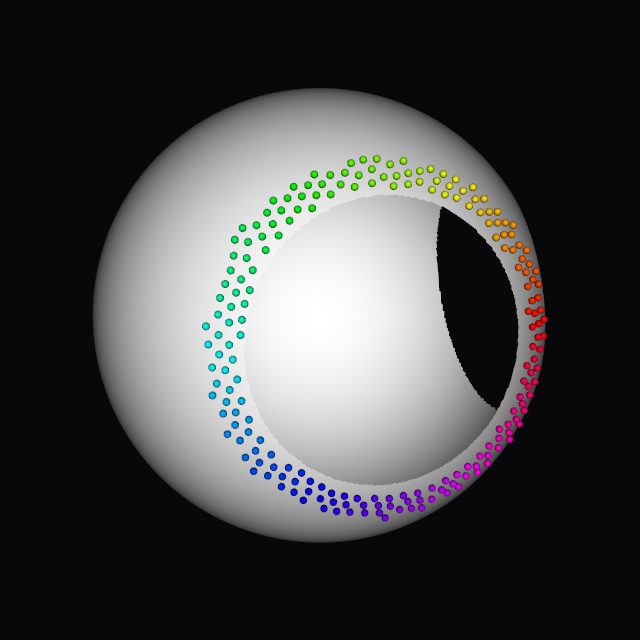
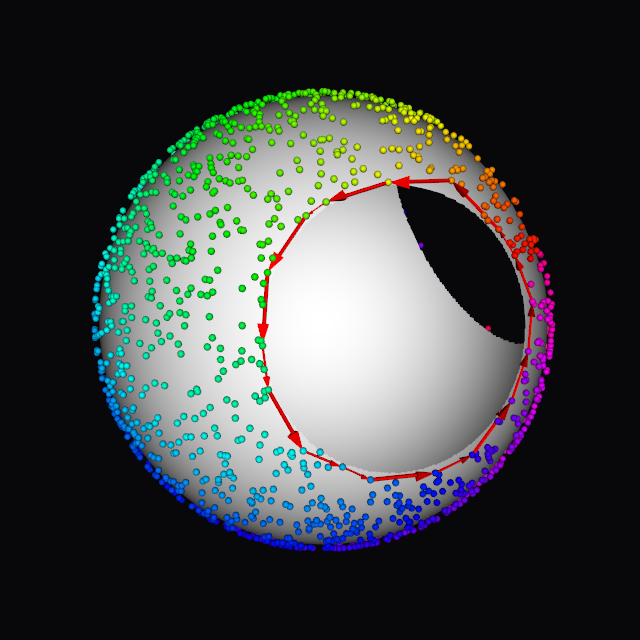
Using the Dijkstra shortest path algorithm, we search our graph for cycles.
The resulting cycles are then clustered using SklClustering, based on the normal of each cycle.
We extract the shortes cycle of each cluster using standard pandas dataframe methods.
# Search for cyclesgraph.search# Cluster based on normal of each cyclecycles = graph.cyclescycles.cluster# Cycle with shortest length from each clusterclusters = cycles.df.groupbymin_idx = clusters["cycle_length"].idxmin
As a bonus, we create an animation of the wave on our mesh.
We permute our scalars one unit for the duration of our period and use these to create a new Mesh object.
period = 260scalars_2d = (scalars[None, :] + np.arange[:, None]) % periodmesh_4d = Mesh.from_arraysplot = Plotplot.add_meshplot.animate
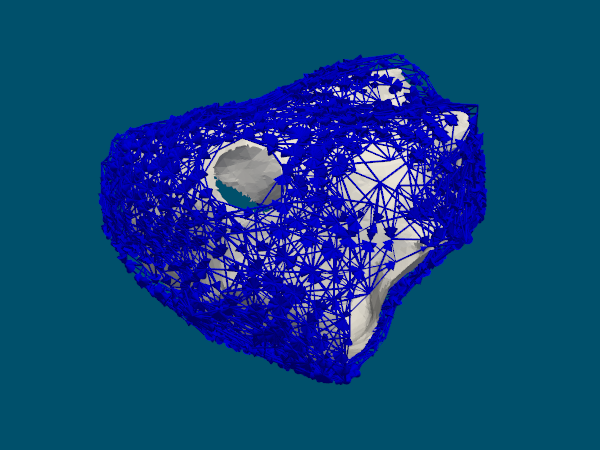 Full graph
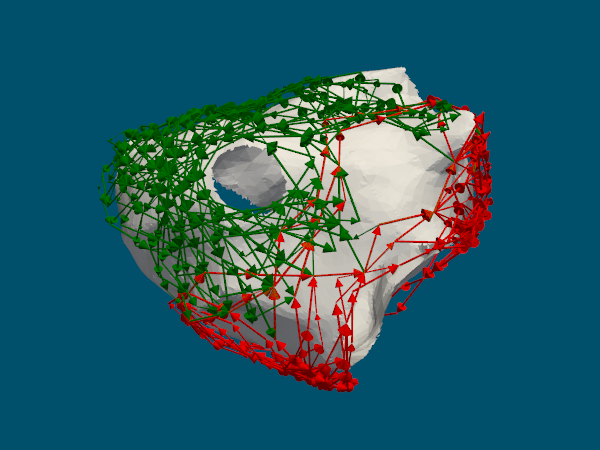 Cycle clusters
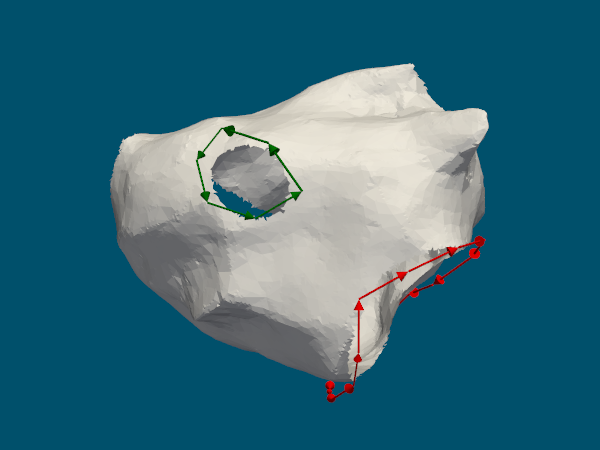 Shortest per cluster
The full example above - including all visualizations - can be found at examples/get_started.py in our repository!
For more examples on the use of each module, please check the examples folder of our repository.
We'd like to hear from you! If you are interested in using OpenDGM, in collaborating with us or want to provide us with valuable feedback, simply send us an email and we will contact you as soon as possible.
For research collaborations
nele.vandersickel@ugent.be
Software-related
sander.hendrickx@ugent.be